Carbon Footprint Planning Tools and Scenarios
CALIFORNIA
Consumption-based greenhouse gas (GHG) emissions inventories have emerged to describe full life cycle contributions of households to climate change at country, state and increasingly city scales. Using this approach, how much carbon footprint abatement potential is within the control of local governments, and which policies hold the most potential to reduce emissions? This study quantifies the potential of local policies and programs to meet aggressive GHG reduction targets using a consumption-based, high geospatial resolution planning model for the state of California. We find that roughly 35% of all carbon footprint abatement potential statewide is from activities at least partially within the control of local governments. The study shows large variation in the size and composition of carbon footprints and abatement opportunities by ~23,000 Census block groups (i.e., neighborhood-scale within cities), 717 cities and 58 counties across the state. These data and companion online tools can help cities better understand priorities to reduce GHGs from a comprehensive, consumption-based perspective, with potential application to the full United States and internationally.
Jones, C., Wheeler, S., & Kammen, D. (2018). Carbon Footprint Planning: Quantifying Local and State Mitigation Opportunities for 700 California Cities. Urban Planning, 3(2), 35-51. doi:http://dx.doi.org/10.17645/up.v3i2.1218
Resources
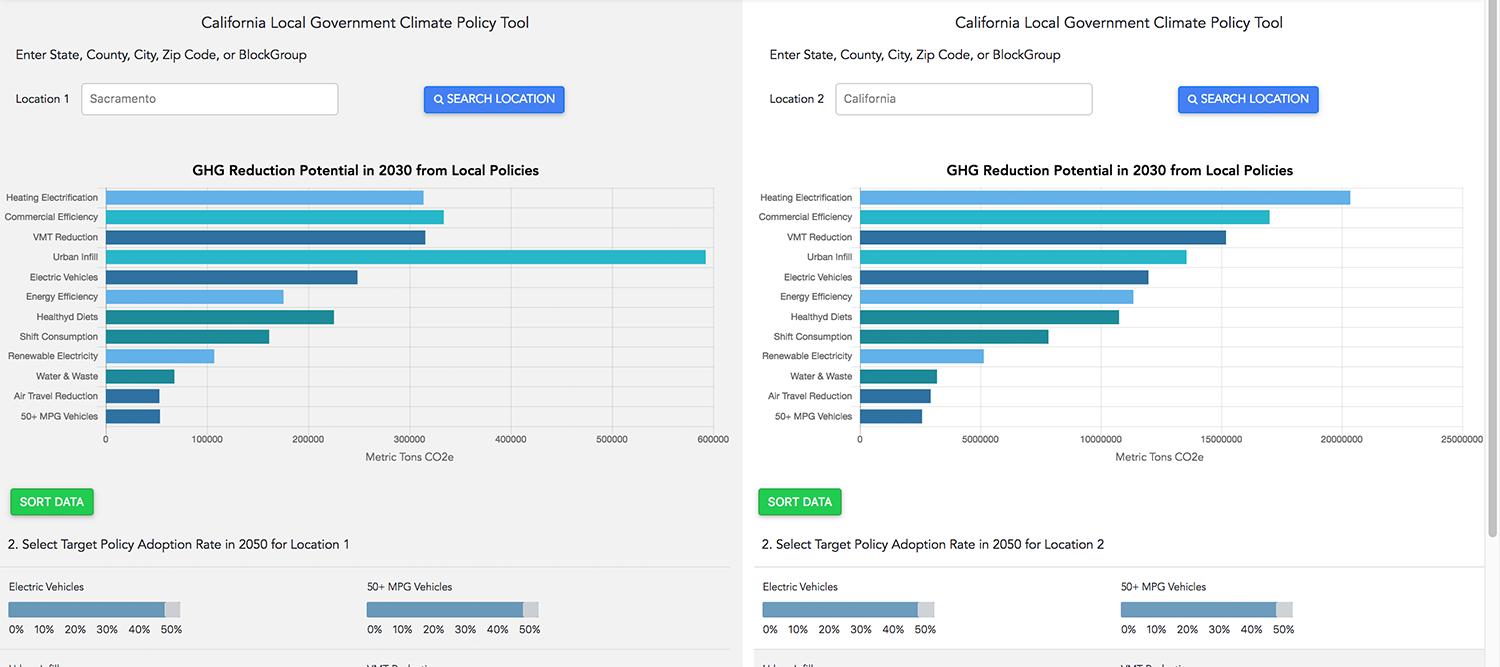
1) Try the Interactive Policy Tool!: GHG reduction potential for every California block group, zip code, city, county and the state overall
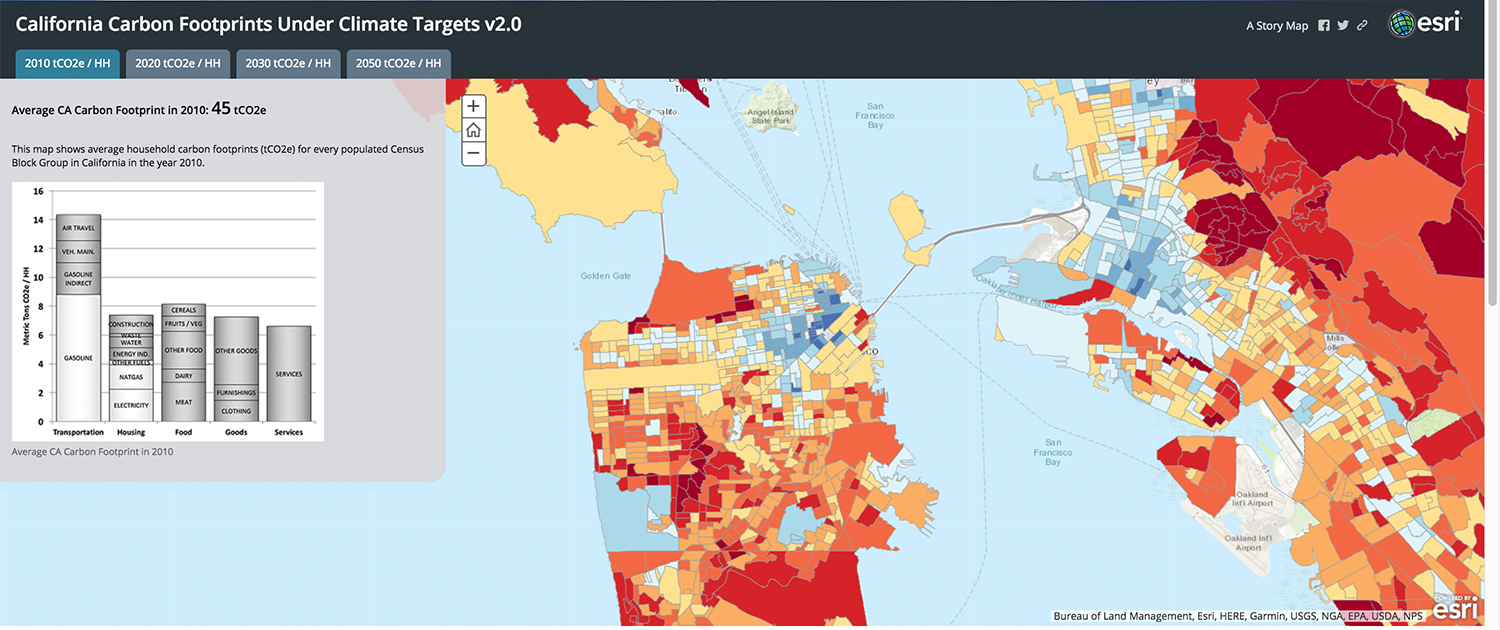
2) Interactive Online Map
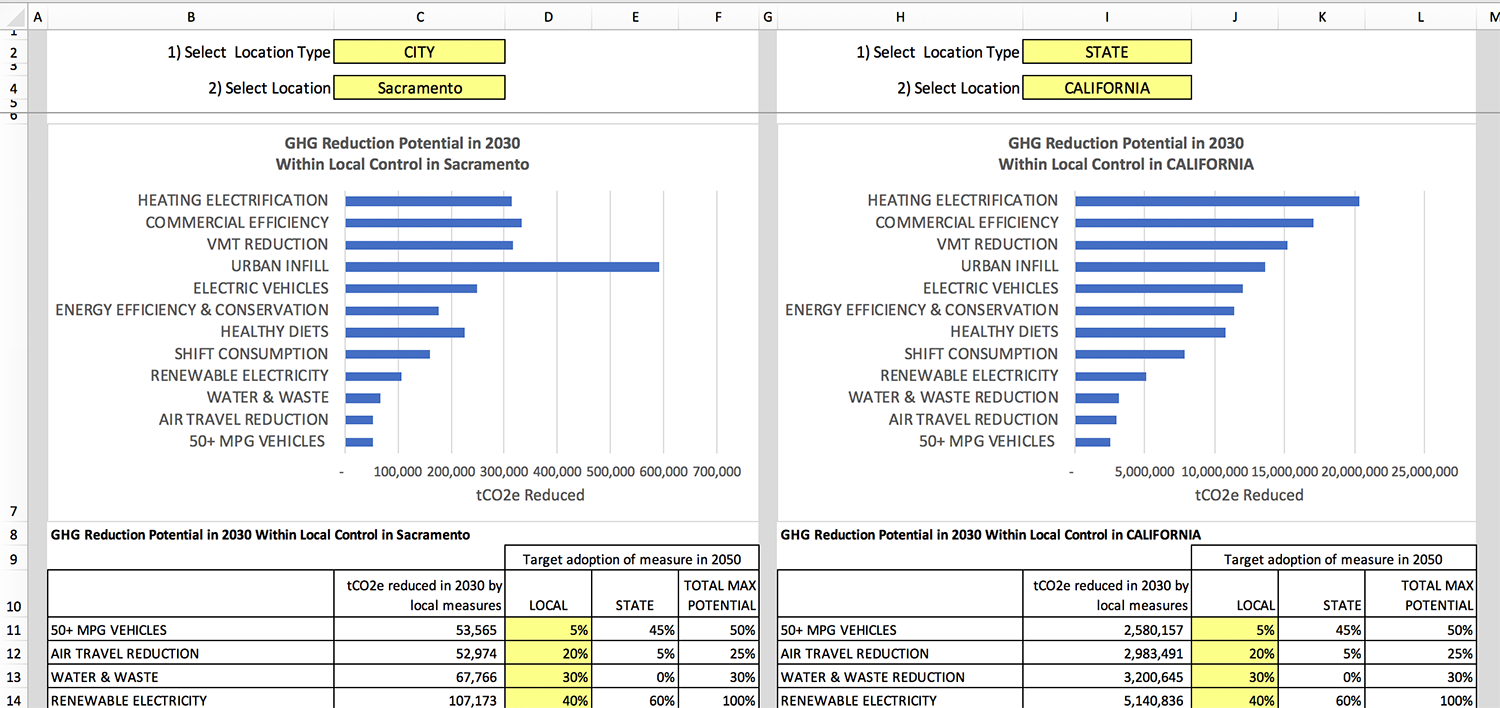
3) California Local Government Climate Policy Tool (Excel Version, 11 Mb)
4) Open Access Version of the Paper (external site)
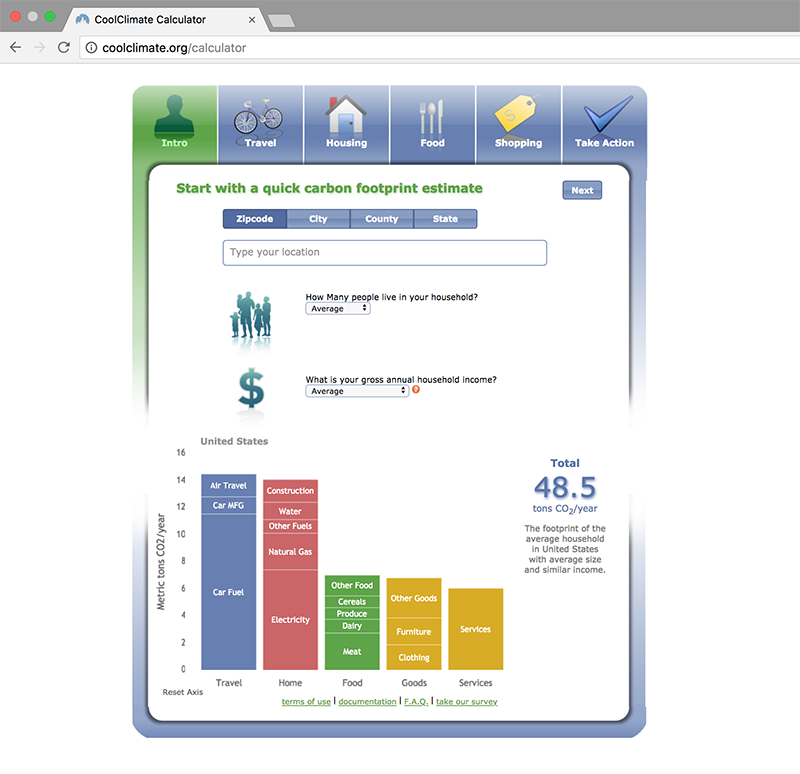
5) CoolClimate Calculator: Calculate and compare your carbon footprint to similar households and create a personalized climate action plan.